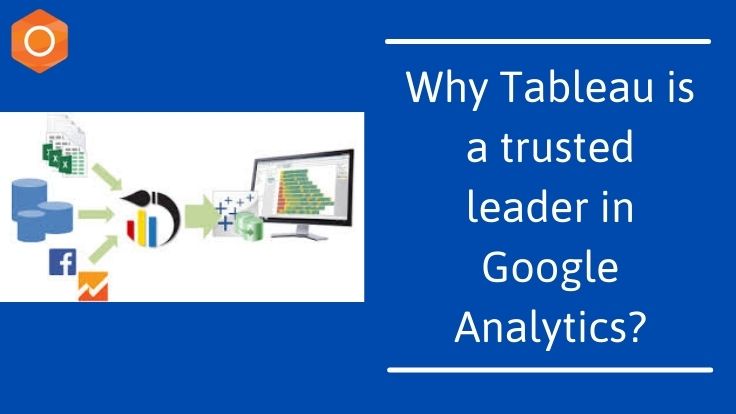
Tableau is an analytics expert and provides solutions for all markets, their teams, and data models. Thanks to the advanced functionality and assistance that Tableau provides in numerous contexts, this is all possible.
Data and its significance are increasing rapidly in today’s world, and with these massive numbers of transactions, there are endless opportunities for businesses to turn data into practical insights. Organizations need tools and services to understand and have the true meaning of their data and get the best out of the data.
The Tableau platform is known for taking any kind of data from almost any device as the market-leading option for modern business intelligence and turning it into actionable insights with pace and ease. It’s as easy as being pulled and dropped.
Related Post: Top Lead Generation Techniques to be considered in 2021
Why Tableau is the most popular Data Visualization tool?
1. Great visualisations
With Tableau, using the built-in features provided by Tableau, you can work with more unordered data and create a variety of visualisations. In addition, within minutes, you will be able to gain great context, many ways of drilling the data and exploring the data.
2. Detailed Insights
Without any potential objectives in mind, Tableau allows organizations to evaluate future data. You will be able to explore visualsations from various methods and observe data. You can frame ‘what-if’ questions with hypothetical visualisations and a function to add components for comparison and interpretation and work on the data accordingly.
3. User-friendly Approach
The major strength of Tableau is the user-friendly feature. This feature shows an individual’s ability to work without any technological or coding expertise. Since Tableau offers most of its features in a drag-and-drop form and each visualisation is built-in and self-depicted, without any previous collection of skills, any newbie can work.
4. Working with the different Data Sources
The explanation of why multiple organisations must add Tableau to the process is that data can come from any source in today’s data-driven world. This role makes Tableau stronger than the tools of Business Intelligence and Analytics. This tool allows numerous data sources, data centres, cloud files, big data, spreadsheet data, non-relational data, and many other data types to be linked. The Tableau.
5. Data set adding is easy
Tableau can quickly add new data sets that can be blended with Tableau automatically using common fields.
Related Post: Generate More Online Sales with Website Redesigning Services
Reasons to choose Tableau for your company:
1. Less time to collect and prepare data
The primary objective of every study is for stakeholders to be able to make precise, timely choices. In order to accurately draw and view details, stakeholders must trust the report author.
The method is time-consuming and vulnerable to errors if data must be manually pulled, prepared, and combined. The integrated data connections and preparation tools from Tableau enable analysts to quickly obtain data in a usable format.
Data preparation time saved means more time for your analysts to do what you hired them for: evaluating knowledge and formulating observations
2. Flexibility for new ideas to learn and try
Most reporting tools enable the analyst to know exactly what they are trying to construct before they start, making a slow trial and error process for initial data exploration.
The drag and drop GUI of Tableau allows your analyst to try new ideas easily, drill into interesting areas, and make changes. The ability to easily explore and create visualizations enables dashboards to provide the information that is most important and appropriate.
3. Interactivity and segmentation on-the-fly
Within the constraints developed by the developer, Tableau enables stakeholders to connect with the dashboard they are looking at and customise it.
4. Share up-to-date dashboards
Sharing dashboards is also done by PDFs sent by email. That is, static representations, in other words. Finding other dashboards or old versions for comparison in these instances involves searching through emails or archives.
.


